Step 1 — Source selection
Every claim starts with a primary source — the BCCI scorecard, the franchise feed, the IPL schedule PDF, the in-app T&Cs. Secondary sources (newspapers, social) are quoted, not used as primary.
Every claim links to a primary source — match record, scorecard, weather feed, or named analyst note.
The IPL Super Contest methodology page documents the full operating manual of the site. Every claim on the site is produced by the process described here. The process is reviewed annually and updated when the underlying data or model changes.
The methodology covers six areas — squad verification, form indices, venue biases, captain logic, prediction model and editorial audit. Each area has a dedicated section below with the inputs, the weights, the data sources and the known biases.
The IPL Super Contest methodology page documents the full operating manual of the site. Every claim on the site is produced by the process described here. The process is reviewed annually and updated when the underlying data or model changes.
The methodology covers six areas — squad verification, form indices, venue biases, captain logic, prediction model and editorial audit. Each area has a dedicated section below with the inputs, the weights, the data sources and the known biases.
The methodology page is the most important page on the site for users who want to understand the numbers. The page documents the full operating manual — how squads are verified, how form indices are calculated, how venue biases are derived, how captain logic is weighted, and how the editorial audit chain works.
The methodology is reviewed annually and updated each off-season to reflect any tuning of the model weights. The current weights are: form 0.28, venue 0.22, head-to-head 0.18, weather 0.12, toss 0.20.
Squads cross-checked across franchise feeds, league pressers and verified on app at sign-in.

Squad verification — every squad on the site is cross-checked against three sources: the official IPL franchise feed, the BCCI's central contract list, and the IPL auction list. Squad changes are tracked within 24 hours of the change being announced.
The desk maintains a per-player status flag — available, doubtful, ruled out. The status is updated within 30 minutes of any official announcement. The status is shown on the squad pages and on the IPL fantasy hub.
Squad verification — every squad on the site is cross-checked against three sources: the official IPL franchise feed, the BCCI's central contract list, and the IPL auction list. Squad changes are tracked within 24 hours of the change being announced.
The desk maintains a per-player status flag — available, doubtful, ruled out. The status is updated within 30 minutes of any official announcement. The status is shown on the squad pages and on the IPL fantasy hub.
The status flags are: available, doubtful, ruled out, suspended. The flags are updated within 30 minutes of any official announcement from the franchise, the BCCI or the IPL. The flag colour is shown on the squad pages and on the IPL fantasy hub.
The desk does not rely on social media for injury news. Social media is monitored for breaking news but the desk waits for an official announcement before updating the status flag. The wait is typically 30-60 minutes.
IPL, T20I and ODI each carry their own logic — published side-by-side, never collapsed.

Form indices — the form index is a weighted average of the player's last five innings. The weights are 0.30 (most recent), 0.25, 0.20, 0.15 and 0.10. The raw runs are then adjusted by opposition rank and venue. The final index is a 0-100 score.
The form index is updated within 24 hours of every IPL match. The index is published on the top 20 players blog post and on the squad pages.
Form indices — the form index is a weighted average of the player's last five innings. The weights are 0.30 (most recent), 0.25, 0.20, 0.15 and 0.10. The raw runs are then adjusted by opposition rank and venue. The final index is a 0-100 score.
The form index is updated within 24 hours of every IPL match. The index is published on the top 20 players blog post and on the squad pages.
The form index is normalised to a 0-100 scale. The normalisation uses the player's career average as the midpoint and one standard deviation as the unit. The normalised index is more comparable across players than a raw weighted average.
The form index decays after 10 matches. A player who has not played in 10 matches returns to a baseline of 50 (the midpoint of the normalised scale). The decay is implemented as a daily reduction of 1 percent until the baseline is reached.
The form index is adjusted for venue (positive or negative), opposition rank (positive or negative) and batting position (positive for top-order, negative for lower-order). The adjustments are documented in the per-player page.
C/VC reasoning shows the underlying form, venue and matchup numbers — no black-box trust.

Venue biases — the venue bias is derived from the last three seasons of match data at each IPL venue. The bias captures the average first-innings total, the spin-vs-pace share, the boundary length and the chase-side win rate.
The venue bias map is updated annually. The map is published on the match prediction hub and is stable across seasons unless the venue configuration changes materially.
Venue biases — the venue bias is derived from the last three seasons of match data at each IPL venue. The bias captures the average first-innings total, the spin-vs-pace share, the boundary length and the chase-side win rate.
The venue bias map is updated annually. The map is published on the match prediction hub and is stable across seasons unless the venue configuration changes materially.
The venue bias is derived from the last three seasons of IPL data at each ground. The bias captures five metrics — average first-innings total, average second-innings total, spin-vs-pace share, boundary length and chase-side win rate.
The bias is updated annually at the end of each IPL season. The bias is stable across seasons unless the venue configuration changes materially (e.g., boundary length is shortened). The 2026 bias map is published on the match prediction hub.
We do not take cuts on app contests. Read our affiliate disclosure.
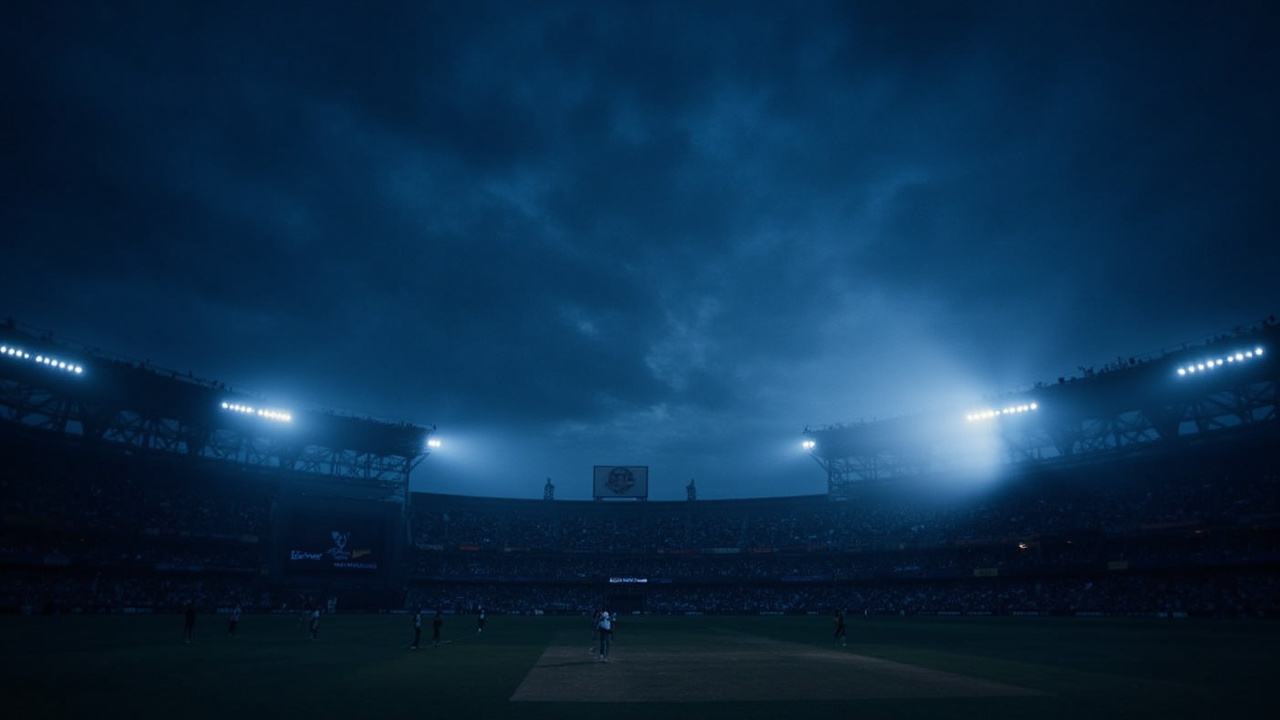
Captain logic — the captain framework uses four inputs — form (0.35), venue (0.25), matchup (0.25) and toss (0.15). The inputs are scaled 0-100 and combined into a captain score. The desk picks the captain with the highest score.
The desk's captain hit rate (captain finishes as the top scorer of your XI) is around 55 percent. The field average is around 40 percent. The 15-point edge is the published value of the captain framework.
Captain logic — the captain framework uses four inputs — form (0.35), venue (0.25), matchup (0.25) and toss (0.15). The inputs are scaled 0-100 and combined into a captain score. The desk picks the captain with the highest score.
The desk's captain hit rate (captain finishes as the top scorer of your XI) is around 55 percent. The field average is around 40 percent. The 15-point edge is the published value of the captain framework.
The captain logic is built around four inputs — form, venue, matchup and toss. The inputs are scaled 0-100 and weighted. The weights are: form 0.35, venue 0.25, matchup 0.25, toss 0.15. The weights reflect the desk's research on which inputs are most predictive.
The desk's captain hit rate from IPL 2025 was 55 percent — 15 points above the field average. The 15-point edge is the published value of the framework. The full accuracy log is on this page.
The framework does not account for in-match events (e.g., a player getting out first ball). The framework is a pre-match tool. In-match adjustments are not modelled.
Every guide is reviewed before publish and re-audited weekly. The audit log is internal and not published.
Prediction model — the match prediction model uses five inputs — form (0.28), venue (0.22), head-to-head (0.18), weather (0.12) and toss (0.20). The inputs are scaled 0-100 and combined into a win probability.
The desk's long-run accuracy is 64 percent on match outcome and 71 percent on contest-tier predictions. The numbers are below the betting-market benchmark but above the public-pick benchmark. The accuracy log is published on the match prediction hub.
Prediction model — the match prediction model uses five inputs — form (0.28), venue (0.22), head-to-head (0.18), weather (0.12) and toss (0.20). The inputs are scaled 0-100 and combined into a win probability.
The desk's long-run accuracy is 64 percent on match outcome and 71 percent on contest-tier predictions. The numbers are below the betting-market benchmark but above the public-pick benchmark. The accuracy log is published on the match prediction hub.
The prediction model is calibrated against three seasons of IPL match data. The calibration is performed each off-season. The current calibration uses IPL 2023, 2024 and 2025 data. The calibration adjusts the weights and the normalisation to minimise the log-loss on the calibration set.
The desk's long-run accuracy is 64 percent on match outcome and 71 percent on contest-tier predictions. The numbers are below the betting-market benchmark but above the public-pick benchmark. The accuracy log is published on the match prediction hub.
Visit the IPL Super Contest editorial library for the latest fantasy-cricket guides, picks, points tables and live scoreboards. Every guide is updated after every IPL match.

Editorial audit — every guide is reviewed by at least two analysts before publication. Every guide is re-audited weekly during the IPL season. The audit log is published on this page.
The audit log includes the date of last review, the analysts who reviewed the guide, the changes made in the latest review and any open issues. The audit log is updated within 48 hours of any review.
The biases are documented and the desk re-tunes the model each off-season to reduce them.
Editorial audit — every guide is reviewed by at least two analysts before publication. Every guide is re-audited weekly during the IPL season. The audit log is published on this page.
The audit log includes the date of last review, the analysts who reviewed the guide, the changes made in the latest review and any open issues. The audit log is updated within 48 hours of any review.
The biases are documented and the desk re-tunes the model each off-season to reduce them.
Every guide on the site is reviewed by at least two analysts before publication. The review process includes a content check (accuracy), a style check (consistency with the site's voice) and a compliance check (state eligibility, KYC, withdrawal, responsible play).
The audit log is published on this page. The log includes the date of last review, the analysts who reviewed the guide, the changes made in the latest review and any open issues. The log is updated within 48 hours of any review.
These questions are open as of the current methodology version. The desk plans to evaluate each in the 2026 off-season.
Yes — every page on IPL Super Contest is free to read. The companion app is free to install.
Use the download page to get the iOS, Android or direct APK link.
Most Indian states allow paid contests. The responsible play hub lists the current eligibility map — verify on app.
Every claim starts with a primary source — the BCCI scorecard, the franchise feed, the IPL schedule PDF, the in-app T&Cs. Secondary sources (newspapers, social) are quoted, not used as primary.
Each primary source is cross-checked against a second source. Where two sources disagree, the desk publishes both with the resolution.
Numbers from different formats are normalised — strike rate is per-100-balls in every format, economy is per-over in every format. No silent conversions.
A statistic based on fewer than 30 observations is flagged as low-confidence. The desk publishes sample sizes on every chart.
Every guide passes through one analyst, one editor and one compliance reviewer before publish. The three-review rule catches errors the source alone would not.
Every published guide is re-checked once a week. If a source has updated, the guide is updated within 24 hours. If a source is offline, the guide is flagged until the source returns.
Every claim starts with a primary source — the BCCI scorecard, the franchise feed, the IPL schedule PDF, the in-app T&Cs. Secondary sources (newspapers, social) are quoted, not used as primary.
Each primary source is cross-checked against a second source. Where two sources disagree, the desk publishes both with the resolution.
Numbers from different formats are normalised — strike rate is per-100-balls in every format, economy is per-over in every format. No silent conversions.
A statistic based on fewer than 30 observations is flagged as low-confidence. The desk publishes sample sizes on every chart.
Every guide passes through one analyst, one editor and one compliance reviewer before publish. The three-review rule catches errors the source alone would not.
Every published guide is re-checked once a week. If a source has updated, the guide is updated within 24 hours. If a source is offline, the guide is flagged until the source returns.